Performance Graph & Dashboard

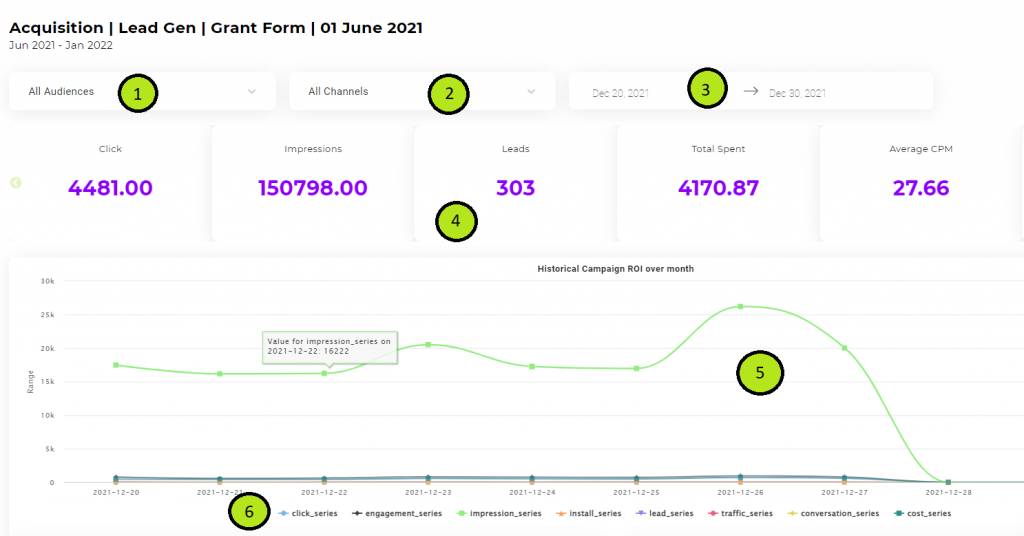
No Explanation 1 Audience Segment. Filter the performance graph and dashboard based on one or multiple audience segments. 2 Channels. Filter the performance graph and dashboard based on one or multiple channels (Facebook, Instagram, Google). 3 Reporting Date Range. Select the report’s date range. The performance graph and dashboard will change correspondingly. 4 Performance Dashboard. Highlight the key metric relevant to your campaign objective. 5 Performance Graph. Display the key metric over the reporting date range. Click on any of the legend to hide or reveal the metric within the graph.
Benchmark Comparison

- Compares this campaign’s performance against your average campaign performance, and other Peasy users within the similar industry as yourself, running campaign with similar objective to this campaign.
No Explanation 1 Cost comparison. Compares this campaign’s Cost Per X against historical and peers. 2 Volume comparison. Compare this campaign’s volume (impression/engagement/lead/conversion – depending on the campaign’s objective) against historical and peer’s campaigns running within the same timeframe.
Audience and Channel Breakdown

Display the key metrics for every audience segment within this campaign, aggregated by channel.
You can use this report to analyze:
a. Channel performance. If a channel has better conversion rate or acquisition cost across all segments, then Peasy will shift more of the campaign budget towards the channel.
b. Channel-Audience-Bias. If a channel outperform only for few audience segments, you might want to consider investing more content development specific for that specific channel.
SWO Analysis

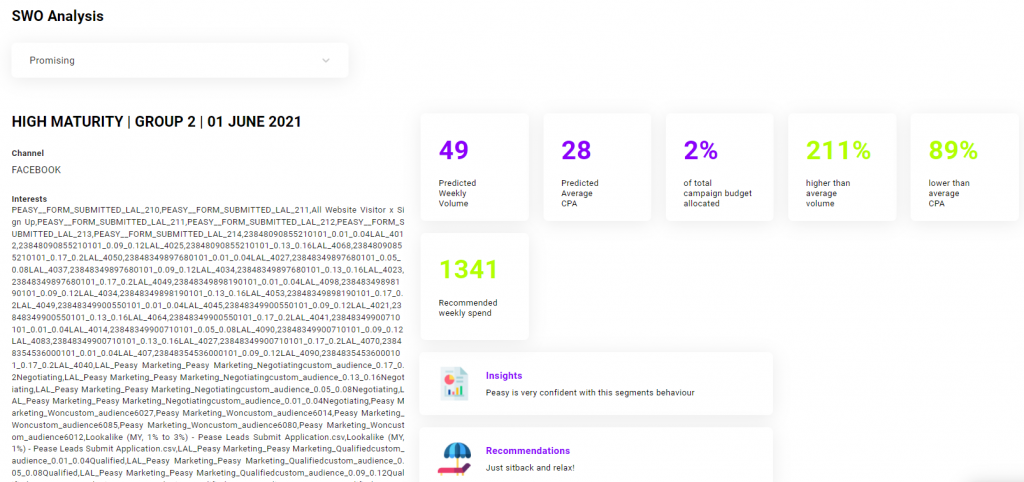
Beyond the existing audience segments, Peasy will further suggest additional new audience segments which you might want to consider. Along with each segment, Peasy recommends:
a. the audience’s persona
b. the predicted volume and cost for this audience segment
c. the recommended budget allocation
d. creative insight
Each recommended segment are classified as:
a. Strength. Existing segment which is performing very well, and our AI is very confident with it’s prediction accuracy. We recommend that this audience segment is left undisturbed.
b. Promising. Recommended mutation or changes to an existing segment, to further improve it’s cost or volume.
c. Weakness. Audience segment which Peasy recommend to be dropped. Dropping a weak segment will reduce the campaign’s total volume but improve the average acquisition cost.
